
When it comes to measuring the success of your video business, each team within your organization will measure performance based on different metrics. Product teams will look at user experience, Editorial will pay attention to content performance, while Revenue teams will look at advertising and subscriber yield.
Because revenue, product, and editorial teams approach and define success differently within their own unique set of goals, we work with publishers to apply video metrics cross-functionally. In this first part of an ongoing series on video metrics, we’ll go over the basics of how our clients optimize their video performance and which metrics they are looking at to track their overall success to tell their unique story.
Key Metrics
- Experience: A playback of an IRIS.TV stream of videos, continuing until the user either exits the player, abandons the stream or clicks on a non-recommended video.
- Initial Views: The first video played by click-to-play and autoplay. Since an initial view signals the start of a new experience, initial views = experiences.
- Recommended Views: A video programmed by IRIS.TV that follows an initial view in a linear stream or in a carousel thumbnail.
- Total Views: The sum of Initial Views and Recommended Views.
- Video Lift: The percentage increase in video views as a result of IRIS.TV video recommendations. This is calculated by dividing Recommended Views by Initial Views.
- Bounce Rate: The percentage of experiences that do not result in the presentation of a recommended view.
Video Views: Initial, Recommended, and Total Views
Most video analytics providers are agnostic to the order in which videos are presented to the user. This is a legacy of the pre continuous play / playlisting era. Nowadays everyone has a manual or automated playlist. IRIS.TV starts counting when the video begins (after the pre-roll if the videos are monetized) and treats “initial views” separately from “recommended views”. Initial views are the number of click-to-play or autoplay video starts (post pre-roll) on the first video in a publisher’s video stream. Recommended views are the number of views generated from video recommendations from either continuous play or carousel thumbnail click-to-play.
Video Lift
Video lift measures the impact of recommendations on a single viewing experience. It is calculated by dividing the number of recommended views by the number of initial views. For example, if you had 1,000,000 initial views and 700,000 recommended views, you would have a 70% video lift. In a previous post, we unpack video lift and ways to increase in greater detail.
Bounce Rate
Bounce rate is an old metric for assessing website engagement. It has traditionally been defined as the percentage of visitors to a particular website who navigate away from the site after viewing only one page.
For IRIS.TV clients, a “bounce” is considered when a user begins an experience that does not result in the presentation of another video. In the IRIS Vision™ dashboard, clients see the top 50 videos in their “leaderboard” which can be sorted by bounce rate to begin to gauge video performance. This percentage is an average of the bounces; it is an aggregated number of the initial and recommended video bounces.
IRIS Vision™ Dashboard - Top 50 Assets in Last 7 Days Filtered by Bounce Rate
A few factors impact bounce rates, such as the quality of your content, asset length, poor or no categorization (metadata is key), and the overall advertising experience.
When it comes to the ad experience, it’s important to consider latency (page load time), as this is still an issue for publishers and users. Since latency issues negatively impact user experience, it ultimately also impacts a publisher’s ROI. A slow to load webpage can kill UX, audience retention, and ad impressions.
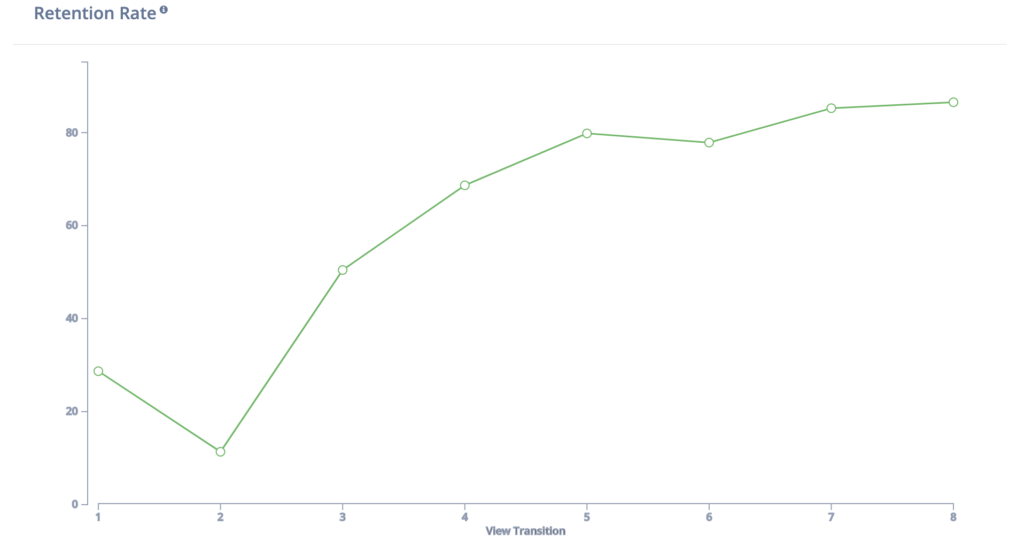
Ad patterns also play a key role in creating an enjoyable and effective ad experience. For example, the number of pre-roll ads you allow to appear before your content can lead to higher or lower user dropoff rates. Over 80% of viewers bounce during pre-roll events.
Example of Poor Retention Rate
Example of Good Retention Rate
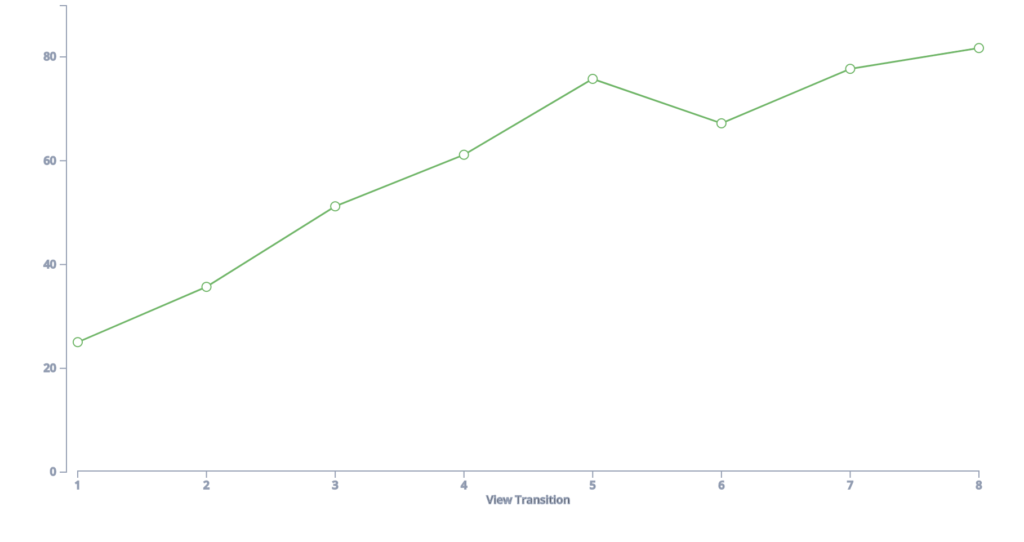
In addition to experimenting with different ad frequencies, many of our clients have worked with brands to create branded video campaigns. As we’ve seen with some clients, branded content when placed in-stream can outperform editorial content.
Device Breakdown
An often overlooked yet important metric for understanding video consumption is device breakdown. Understanding the nuances of how audiences consume your content based on the device they’re using is key to retaining users and building loyal audiences.
IRIS Vision tracks the consumption behaviors of audiences across mobile and desktop separately and together, providing insight into how certain video assets should be geared toward audiences on desktop versus mobile, and how the ad experience should be adapted to each device as well for optimal results. Typically, although it depends on the client, our data has shown higher bounce rates on mobile versus desktop.
One of our national entertainment clients wanted to gauge the performance of Game of Thrones content across platforms, with an emphasis on mobile since their mobile audiences increased when the show aired on the weekend. The client was able to gauge the proper asset length and content type to feature on the weekends versus weekdays to drive overall audience retention.
Piecing the Video Puzzle Together
Every video metric is like a piece of a larger “video ROI” puzzle, they’re all connected and equally impact the overall video performance picture. Editorial will look at content that is performing well (low bounce rate) and will inform their strategy to create more of that type of content. Based on what’s driving audience retention, content creators will look to replicate that. For advertising sales teams, understanding which assets are performing well is a good indicator for targeting those relevant assets for the next branded campaign, to drive higher completion rates. Product teams will look at retention as well since retention is key to every product the team creates, as their goal is to keep audiences on the publisher’s owned and operated sites to engage with even more content.
Recently, the NBA playoffs served as a tentpole event for a sports client that was looking to drive content consumption, audience retention, and overall increased monetization for their ad sales team. In order to prepare for the opportunity, the team analyzed the performance of overall sports content to gauge the best performing asset length across platforms, what specific content around the NBA performed well, and how best to feature and monetize this content on the site. Using IRIS Vision, the team was able to implement a cross-departmental strategy that leads to increased user loyalty and monetization.
Check back for future posts in this video metrics series where we will cover other video metrics to track and how to utilize them to improve video performance.

.jpg)